
Mini-Frac Treatment: The outline of mini-frac execution
- Aug 25, 2016
- 3 min read
This blog serves as the second installment in our Blog Series: Mini-Frac Treatment, The Key to Successful Hydraulic Fracturing
In the last blog, we outlined the basics of mini frac, why and how its conducted and how it can be used to minimize the several uncertainties of subsurface before we execute the main treatment. As stated earlier, through minifrac, we can directly or indirectly estimate Formation breakdown pressure, treatment pressure, frictional pressure losses, frac and closure gradients and fluid leakoff properties etc. Lets take a closer look at the technical details of each one of them.
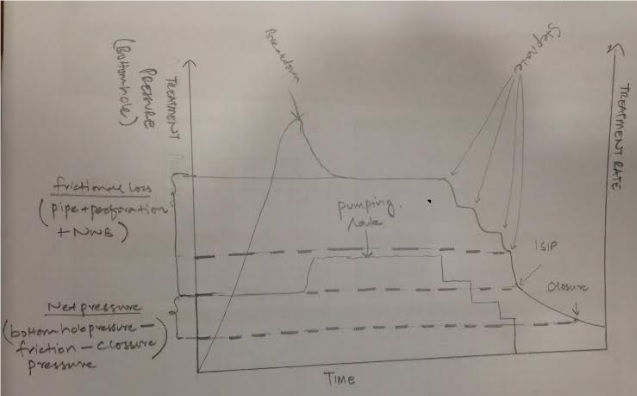
The highest surface pressure encountered during frac execution job is when formation breaks apart upon exposure to hydraulic force. This is known as bottomhole breakdown pressure, which is translated to surface treatment pressure in following terms:
Surface Formation breakdown pressure: Bottomhole breakdown pressure – Hydrostatic pressure
This piece of information is most critical in selection of appropriately pressure rated surface and downhole completion tools. Typically the bottomhole breakdown pressure gradient may be anywhere between 1.1-1.5 psi/ft, however, it is greatly dependent on rock nature and drilling & cementing practices. Operators widely utilize acid stimulation of rock with coiled tubing to lower down the surface treating pressure requirement below the limits.
Formation breakdown is conventionally followed by pumping of linear gel (10-40 pounds of polymer powder hydrated per 1000 gals water) at stable rates until the pre existing wellbore fluid is pushed down and the gel hits the formation. An intuitive rise on pressure curve is observed due to interaction of more viscous fluid with the rock, however, the impact is alleviated through adding friction reducers and surfactants in the gel recipe. Next step is to start adding liquid X-linker with known concentration into pumped liner gel. X-linking time is so adjusted that fluid stays linear while it travels over 90% of the pipe distance (with lesser viscosity and frictional pressure losses) and gets X-Linked right before hitting the perforations. X-linked gel is a typical non-newtonian (shear thining) fluid with viscosities in range of 600-800 cP at shear rates of 170 Sec-1. Such big leap of fluid viscosity from 50-60 cP (linear gel) brings along significant pressure losses as it grinds through perforations and twists and turns of fracture face. At a given pumping rate, comparison of treating pressures with water, linear gel and X –linked gel gives a quick idea of X-linked fluid frictional performance in wellbore and across near wellbore region. Pumping rate conventionally being lower through initial phase of the test is now taken upto desired treatment rates in accordance with main treatment design. Prior to investing the larger amount of resources for main job, this is done to validate that the designed treatment rates can actually be achieved within operational limits.
This is generally followed by step down rate test. For example, towards the end of a treatment with pumping rate of 25 bpm, a step down rate test would be done by bringing the rate one notch down to 20 then 15 and so on down to 5 bpm and waiting each time until surface treating pressure stabilizes (usually about 5-10 seconds). This is followed by pump shut-in and fall-off period.
At any given time during treatment, the surface treatment pressure is the resultant effect of net pressure, closure pressure, frictional pressure losses and hydrostatic pressure such that:
Surface treating pressure = Net Pressure + Closure Pressure + Frictional Pressure Losses – Hydrostatic Pressure
Where,
Net Pressure (pressure in excess of closure pressure) = Pressure inside fracture – Formation Closure Pressure
Frictional Pressure Losses = Pipe friction + Perforation Friction + Near Wellbore Friction
Above mentioned key variables chiefly define the execution of frac treatment, where net pressure also being the key parameter defining the fracture geometry and consequently post fracture performance. Prior to main frac treatment these are extracted out through analyses of Minifrac.
This was a detail walk-through of different phases of minifrac execution with focus on the parameters that are taken from the different aspects of minifrac. In the next installment of this blog series, we will describe the physics and mathematics behind each parameter to understand how a commercial frac simulator takes pressure data as input and provides subsurface rock properties as output.
If you like this blog, kindly share and comment.


Comments